您当前的位置:首页 > 科研进展
[发布日期: 2023-09-07 浏览量 4594]
【中文介绍】
在过去几十年中全球平均温度呈上升趋势,这一点已被广泛认知。但是,与之相关的极端气候事件是否会更加频繁的发生仍然是一个未知数。温度变率的变化能显著改变极端气候,并可能会对人类社会及其他生物产生难以预估的影响。虽然温度变率有重要的研究价值,但是现阶段对全球尺度变率将在未来如何演变尚不清楚,因此,我们利用最先进的模式来预测全球温度变率的变化并分析其潜在机制。
课题组利用CMIP6模式数据,在三个共享社会经济路径下(SSP1-2.6,SSP2-4.5,SSP5-8.5)研究21世纪地表气温年际变率变化。相对于1961−2014年,2051−2100年全球年平均温度年际变率在SSP1-2.6,SSP2-4.5,SSP5-8.5情景下分别增加6%,6%,和12%,其中,在低纬度地区平均增加10%−22%,而在高纬度海洋平均减少3%−28%。冬季变率变化的空间分布主要由经向温度梯度决定。根据对下垫面变化的分析可知,中高纬度地区温度变率的大幅降低与该地区海冰减少以及积雪变化有关。在南美和南非,变率的增强和干湿状态的调整有关,而在南亚和非洲中部,由于云层增加所导致的正长波辐射效应是该地区变率增加的主要原因。在热带海洋上,海温变率和海气相互作用的同时增加主导了海温变率的增强。
【英文介绍】
Although the rising trend of the global mean surface temperature over the past decades is relatively well understood, it remains uncertain whether the associated climate extremes will become more frequent. Changes in temperature variabilities, which can substantially alter climate extremes, may exert considerable influences on human societies and species. Despite the importance of temperature variabilities, how temperature variability will evolve under the latest future pathways remains unclear, and thus, it is imperative to use state-of-the-art models to project global changes in temperature variability and underlying processes.
We investigate the interannual variability of surface air temperature in the 21st century using the Coupled Model Intercomparison Project Phase 6 (CMIP6) model data under three shared socioeconomic pathways (SSP1-2.6, SSP2-4.5, and SSP5-8.5). Relative to 1961−2014, the interannual variability of annual temperature is projected to increase by 6%, 6%, and 12% globally in the 2051−2100 period under the SSP1-2.6, SSP2-4.5, and SSP5-8.5 scenarios, respectively, with an average increase of 10%−22% in low latitudes and decrease of 3%−28% in high-latitude oceans. The spatial pattern of wintertime variability changes is mainly determined by variations in the meridional temperature gradient. Sea ice losses and variations in snow extent in the mid to high latitudes are both related with large variability decreases according to analysis of the underlying surface. In South America and South Africa, the variability enhancement is related to the adjustment of the wet–dry status, while that in South Asia and central Africa depends more on the positive longwave radiative effect due to the increase in clouds. In tropical oceans, the increases in sea surface temperature variabilities and air–sea interactions dominate the enhanced surface air temperature variability.
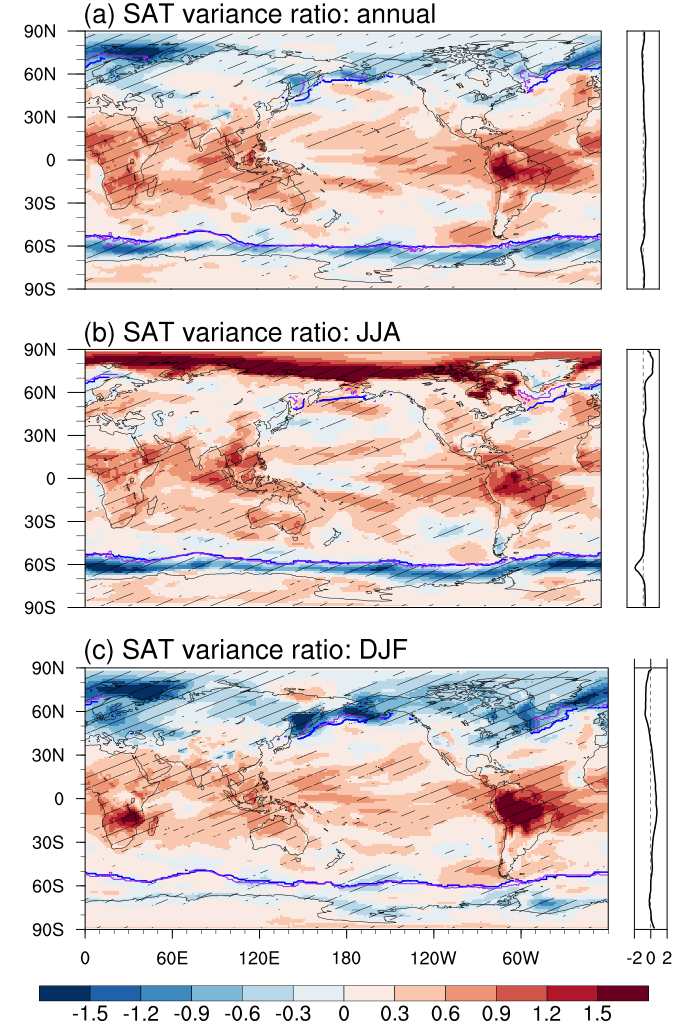
图 1(a)年,(b)JJA,和(c)DJF平均下SSP5-8.5(2051−2100)与历史时期(1961−2014)地表气温方差比的32个模式平均结果,右侧为纬向平均值。在每张图中,方差比取log2值,因此图中−1,0,和1分别相当于方差比为1/2,1,和2的情况。32个模式中至少有23个模式变率变化方向一致的区域则打上阴影。蓝色和紫色粗线分别表示历史时期和未来情景下厚度大于1 cm的海冰边界。
【引用格式】
Shi, J., Z. Tian, X. Lang, and D. Jiang, 2023: Projected changes in the interannual variability of surface air temperature using CMIP6 simulations. Climate Dynamics.